

How can I run the compiled *.bie and *.nef and get the hardware usage of the Kneron dongle?

How can I run the compiled *.bie and *.nef to inference and get both result and hardware usage of the Kneron dongle?
Like Nvidia Nano has their own command 'tegrastats' to get the hardware information during inference, such as CPU usage (here I want to know NPU usage), memory usage, and so on.
I wonder if the Kneron KL520 dongle provides some function or program to get the report of model run time usage?
I've already got:
fpAnalyser
- *.quan.wqbi.bie'
batch_compile
- models_520.nef
- fw_info.bin
- all_models.bin
- ...other txt, csv, bin or log files
compiler
- commanf.bin
- ioinfo.csv
- ip_eval_prof.txt
- setup.bin
- weight.bin
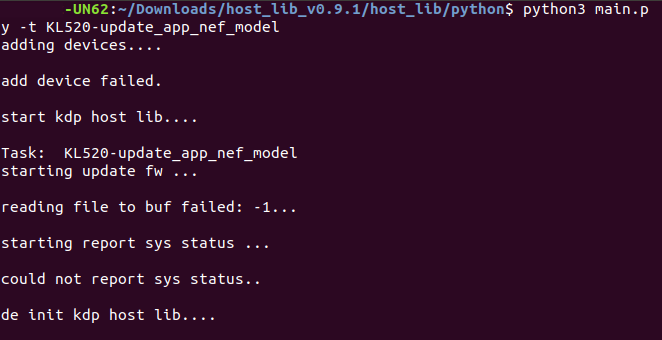
I've been tried to use 'update_app_nef_model.py' but it got failed.
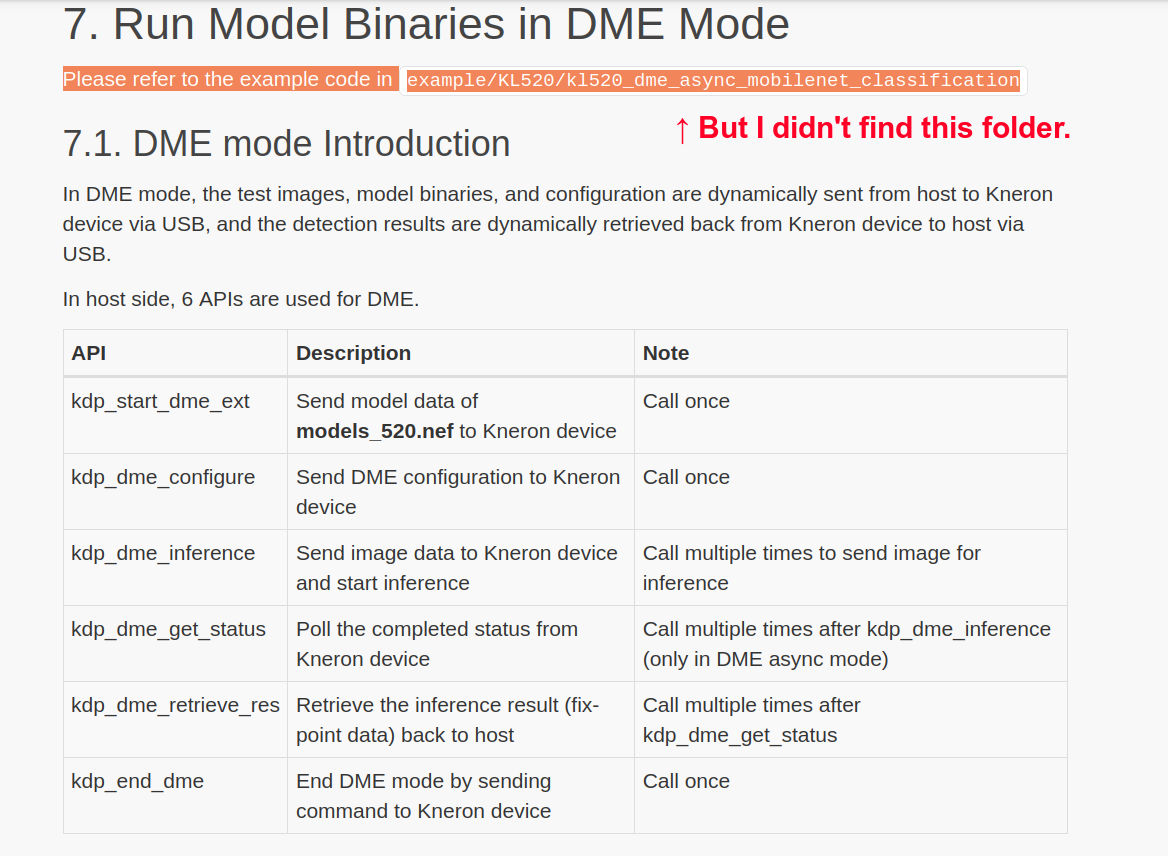
I also try to run in DME Mode, but I didn't find the folder mentioned in the documents, and I checkout another folder under this directory does DME mode only work with C?
Comments
The *.bie is a quantized model, you can run it on End to End Simulator. http://doc.kneron.com/docs/#toolchain/python_app/app_flow_manual/
And the *.nef is a model format for kneron dongle (KL520/ KL720), which was compiled from *.bie.
To run inference with your own model, you should prepare following items.
About the "update_app_nef_model.py" issue you encountered, the error message showed "add device failed", which means the dongle was not detected. Please re-plugin dongle and try the program command again.
About DME (dynamic model inference ) mode, it means dongle will load the inference model( *.nef) from your pc through usb. It's a simple way to get inference result from your own model.
Both python and C project support DME mode, but the example "kl520_dme_async_mobilenet_classification" only exist in C project. You can find it in the latest host_lib (v1.0.0)
If you want to run DME with python, you can refer to other DME example like "cam_dme_serial_ssd_fd.py" or "cam_dme_serial_post_host_yolo.py".
Or you can get more python example from our github https://github.com/kneron/host_lib.
Thanks for your kind response, after reading your answer I have 2 more questions:
1. Did you provide any API to get the AI Dongle's run-time hardware usage information?
2. About the DME mode:
About the "update_app_nef_model.py" issue I found that was caused by I didn't add the "sudo" before the command.
And about DME mode I checked the mobilenet example :
Then now I want to modify the sample code and build it again, but I didn't know how to generate the image bin that shows in the picture below.
About your question:
1. Did you provide any API to get the AI Dongle's run-time hardware usage information?
What kind of information you want to get? You can find all corresponding APIs from following link.
http://doc.kneron.com/docs/#host_lib_1.0.0/kdp_host.h/
2. About the DME mode:
The example are run inference with pre process RGB565, so we transferred 2 images (a_cat_640x480_rgb565.bin and a_dog_640x480_rgb565.bin) into bin with format RGB565 and resolution 640x480 before inference.
The RGB565 is a general format, you can find many transferring tool online or implement it with python.
example:
from PIL import Image
image = Image.open(fileName)
image = image.convert('RGB')
width, height = image.size
print(width, height)
rgbArray = []
for y in range(0, height):
for x in range(0,width):
r, g, b = image.getpixel((x, y))
#print("r = " + hex(r>>3) + ", g = " + hex(g>>2) + ", b = " + hex(b >> 3) +", x = " + str(x))
rgbValue = ((r>>3) <<11 ) | ((g >> 2) << 5) | (b >>3)
rgbArray.append(rgbValue & 0xff)
rgbArray.append(rgbValue >> 8)
# binary saving
newFile = open(saveFileName, "wb")
newFileByteArray = bytearray(rgbArray)
newFile.write(newFileByteArray)
@Ethon Lin Thanks for your reply, I finally can run the DME mode with a custom model.
> What kind of information you want to get?
I want to get NPU usage, memory usage during the inference runtime, like system monitor. But in the link you provide, I didn't find what I really want.
I have look through the whole document and try a few of the functions, I pick one of them that seems a part of what I need, but what is sys_status = 0, application status = 3 mean?
The control flow of NPU is "host_lib <-> scpu <-> npuc <-> NPU". And there are 2 ways to get inference with your image and model, "DME mode" and "ISI mode". Both instructions of these two modes can be found in our document center.
And there is no system monitor for KL520, you can only get status by APIs.
With API "kdp_report_sys_status", sys_status = 0 means the system is not in sleep mode and application status = 3 means you are using DME mode.